| Oct. 18 | |
| Without Rasmussen or Pulse polls |
|
|
|
| |||||||||||||||||||||||||||||
| Senate polls today: | HI UT | |
|
||
| Dem pickups: | (None) | GOP pickups: | AR CO IL IN ND PA WI | |
|
| |
|
|
|
|
| |
|
|
|
|
| |
|
|
|
|
News from the Votemaster

Brief Reminder PermalinkIf you didn't check this site during the weekend, the little iPhone icon below and to the right of the map legend takes you a page with a free app for tracking this site on an iPhone. Also, clicking on a state on the map now gives two graphs, one for just September-October and one for the whole year. If you check this site only on weekdays, you can always see the headlines for the past few days at the bottom of the front page. New Way of Predicting the House Results PermalinkThe Senate predictions are fluctuating in a narrow band but House predictions from various experts are all over the map. The base problem is that there have been only 166 nonpartisan House polls this year and these cover only 81 congressional districts. There are 27 districts that could conceivably go either way that have not been polled by a reasonably trustworthy pollster. These are AL-02, AZ-05, AZ-08, CA-04, CT-04, FL-22, FL-24, GA-08, IA-02, IL-14, IL-17, KS-03, LA-04, MI-08, MI-09, MI-11, MN-03, MS-01, NM-03, OH-12, OR-05, PA-04, PA-06, PA-12, TX-23, VA-11, and WI-08. How do you make a prediction when there are no data for 27 critical districts? One approach that some people have used in desperation is to count the polls released by the DCCC, NRCC, and the candidates themselves. Mark Blumenthal of the Huffington Post and Nate Silver of the NY Times, for example, count them (in Silver's case, discounted though). A better way might be to take a sheet of paper with the candidates names on it and let a well-fed cockroach walk over it and see where it poops. At least that would be random and not biased. The partisan polls are released for one purpose only: to drive the media narrative to help their candidates. They shouldn't be published or taken seriously at all. So what's left? The experts divide into two groups. One group looks at all 435 House contests one at a time and tries to predict the winner, then adds up the totals. This might be called the microeconomic model. The other group looks at coarse indicators, such as the national generic party preference and tries to come to the total number of Democratic and Republican seats, without predicting specific races. Here is a different way of looking the matter. Although it is also "macroeconomic," to the best of our knowledge, no one has done this analysis before. The basic idea is that we know that the party controlling the White House nearly always loses seats in both the Senate and House in the midterms. There is plenty of data on that. The table on the left below shows the actual numbers for all the midterms since WWII. Negative numbers mean the party in the White House lost seats; positive ones means it gained seats.
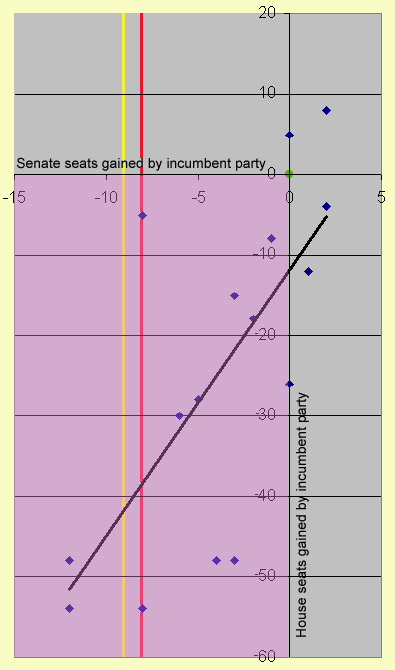
The thought arises that maybe the loss in the Senate and the loss in the House are correlated: the bigger the Senate loss, the bigger the House loss. The way to see this is to make a scatterplot, with the horizontal coordinate being the Senate loss and the vertical coordinate being the House loss. So the 1946 data would appear at x = -12, y = -54. This is the little diamond closest to the lower left-hand corner in the figure above on the right. All the other data points are also plotted in this figure. If there were perfect correlation, all the points would fall on a straight line, which they clearly do not do. Nevertheless they do roughly fall around a line running from the lower left-hand corner to the upper right hand corner. If you are not a statistician, this paragraph may be gibberish, so just skip it. Since the incumbent party generally loses seats in both the Senate and the House, most of the data points are in the third quadrant, which is colored purple in the figure with the green dot indicating the origin. The line shown in black in the figure is a least-squares linear-regression fit to the data. Visually, a higher-order fit or some kind of a spline is probably meaningless. Using the number of losses in the Senate as the independent variable, the line gives us the best prediction of the number of House losses. Of course, Senate losses do not cause House losses, but they clearly correlate. The vertical red line is drawn through the point corresponding to a Democratic loss of 8 seats in the Senate. Given our current data, that is certainly a real possibility. It intersects the black line at a point corresponding to a (net) loss of 38 seats in the House, which would give the Democrats a 1 seat margin, 218 to 217. To achieve a net gain of 38 seats, the Republicans would probably have to beat 42 or 43 Democrats or Democratically held open seats since they are likely to lose 4 or 5, as discussed here Saturday. The yellow vertical line is for a bigger wave and a 10-seat loss in the Senate. It intersects the black line at a (net) loss of 42 seats, which would give the Republicans a 221 to 214 majority. The case of the Democrats losing 9 seats in the Senate is halfway in between, so it would correspond to a bare Republican majority of 219 to 216. So if you could tell how many seats the Democrats are going to lose in the Senate, you would have some indication of the size of the wave and thus have some historical basis for predicting the loss in the House. The only real problem with this model (other than it being an approximation, since there is a fair amount of scatter in the data), is that the size of the Senate loss isn't certain. It is likely to be in the range 8 to 10, but there could be surprises either way. In most elections, there usually are a few. Many Three-Way Races This Year PermalinkIn almost all elections there are half a dozen independents or parties on the ballot, but most of them get well under 1% of the vote and generally disappear in the noise. However, this year is different. In two Senate races and three gubernatorial races there are independents on the ballot who might affect the outcome or even win. The Senate race where someone other than the official Republican or Democrat has the best chance is Alaska, where Sen. Lisa Murkowski (R-AK) is trying to pull a Lieberman and win anyway after losing her primary. Unlike Sen. Joe Lieberman (I-CT), who actually formed a new party and got on the Connecticut ballot in 2006, Murkowski is running as a write-in candidate. It would have been easier had she been named Miller and the official Republican had been named Murkowski, but it's the other way around. She has spent the past month teaching Alaskans how to spell M-u-r-k-o-w-s-k-i and how to fill in the oval next to the write-in space, but polls show the race as close to a three-way tie, with Joe Miller (R) just 1% ahead of her and Democrat Scott McAdams not far behind. The other Senate race where an independent might have an effect is Florida, where Gov. Charlie Crist (R-FL) chose to drop his primary campaign and run as an independent (because he saw he would have lost the primary). So far, he is trailing Marco Rubio (R) by 10-15%, but there is at least a chance that Democrat Kendrick Meek will drop out and endorse Crist (presumably in return for a job, since he will be unemployed come January). If that happens, Crist would become the instant favorite. Independents are playing a big role in three gubernatorial races. In Rhode Island, former Republican senator Lincoln Chafee is in a statistical tie with Democrat Frank Caprio, with the Republican far behind. The Chafee name is well known in Rhode Island, since Lincoln served 8 years in the Senate and his father, John, served there for 24 years--after having been governor for two terms. Chafee has a real shot at it. In a surprising turn of events, tea party favorite Dan Maes (R) beat the Republican establishment candidate, Scott McInnis (R), in the Republican primary in August. Since then, he has spouted off so much crazy stuff that former representative Tom Tancredo (R) issued an ultimatum: if Maes didn't drop out of the race, Tancredo would enter it. Maes didn't and Tancredo did. The most recent poll puts Democrat John Hickenlooper, the mayor of Denver, at 42%, Tancredo at 38%, and Maes at 12%. Tancredo, who wants to take an extremely tough line on illegal immigrants, is drawing all his support from Maes. Hickenlooper is still the favorite, but Tancredo has been rising rapidly in the polls. In the third three-way gubernatorial race, Tim Cahill, Massachusetts' Treasurer, is running against both incumbent governor Deval Patrick (D-MA) and Republican Charlie Baker. He is unlikely to win, but he could be a spoiler. Taxonomy of Political Debates PermalinkThere have been numerous "debates" between candidates this year. Actually, none of them have been real debates, but more like intertwined question-and-answer sessions between candidates and moderators. Chistopher Beam of Slate has examined them and come to the conclusion that there are four kinds, as follows.
Today's Polls: HI UT MN-01 NH-01 NH-02 NY-25 PermalinkNew Senate Polls
New House Polls
If you like this Website, tell your friends. You can also share by clicking this button
|
Your donation is greatly appreciated. It will buy ads to publicize the site. |