Virginia Polls
 |
| |
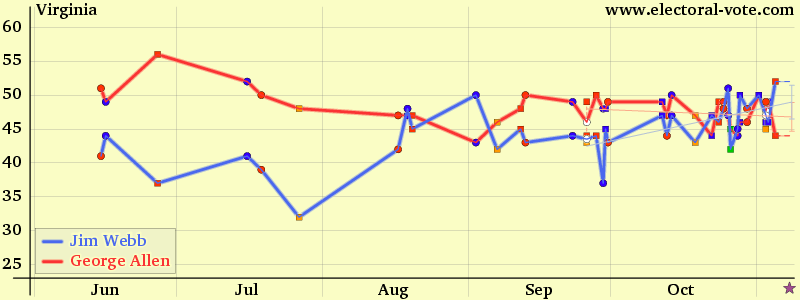
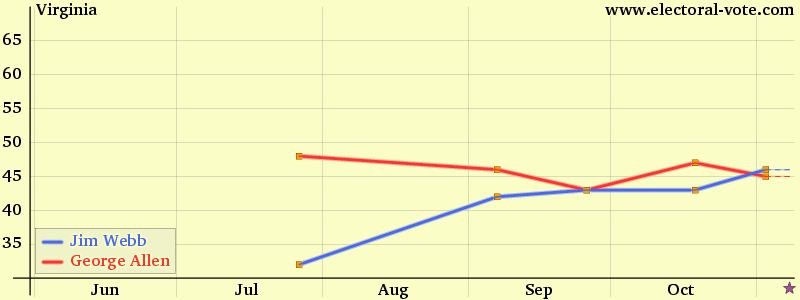
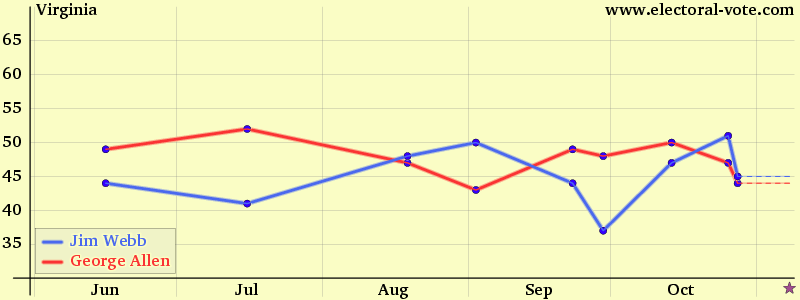
The y axis is the percentage of the voters who said they would vote for the candidate. Every point is plotted on the middle date of its poll. The trend lines are least-squares fits looking back 6 weeks but only if at least four polls are available in that time period.
For additional state polls, click on a state abbreviation or Next:AZ CA CT DE FL HI IN ME MD MA MI MN MS MO MT NE NV NJ NM NY ND OH PA RI TN TX UT VT VA WA WV WI WY
Mason-Dixon
Rasmussen
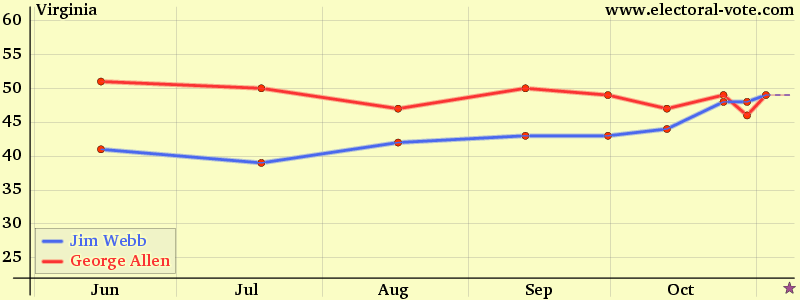
Survey USA
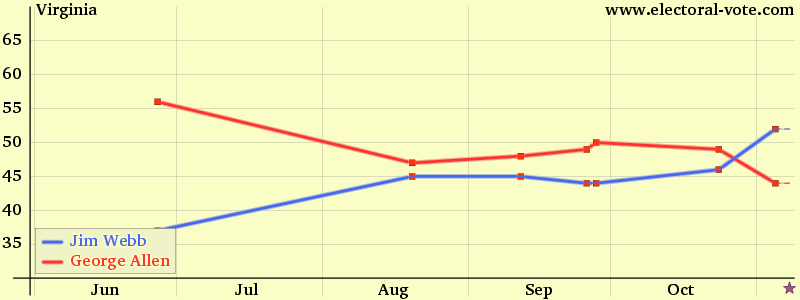
Zogby
Back to the main page.