Former Wisconsin governor Tommy Thompson (R) and Rep. Tom Tancredo (R-CO) have
joined the race for the Republican nomination for President. Thompson was a popular
governor and then cabinet secretary in the Bush administration. His biggest problem
will probably be people confusing him with former Sen. Fred Thompson (R-TN) who
seems interested in running too but has not yet announced.
Tancredo is a one-issue candidate--immigration--who has no chance of winning but
who has a big chance of making immigration a topic the other candidates cannot avoid,
something they desperately want to do because the Republican party is badly split
on this issue. Tancredo and the other build-a-big-electric-fence types don't want any
more immigrants, especially not Mexicans. On the other hand, big business loves
immigrants because they work for peanuts and don't complain. Karl Rove also sees
a pro-immigrant policy as helping to peel Latinos away from the Democrats. Consequently,
Republicans don't want to talk about immigration at all. Tancredo's entry makes the
subject hard to avoid since he is Johnny-one-note on immigration. Every time he makes
an inflammatory statement, the press will ask the other candidates to respond, something
they would rather not do. For the Democrats the situation is simpler. They are pro-immigrant
and anti-fence as the only constituency within the party that wants to keep immigrants
out is organized labor, and they are a shadow of their former selves.
Besides, the immigrants tend to take low-skill jobs that don't threated unionized factory workers directly.
Here are some more state polls. As usual, Iowa is the most important, but take all
this data with a barrel of salt.
State
Pollster
End date
Clinton
Obama
Edwards
Giuliani
McCain
Romney
Alabama
Capital Survey
Mar. 6
35%
19%
9%
28%
23%
3%
Alabama
ARG
Feb. 13
44%
13%
11%
31%
19%
3%
Alabama
Capital Survey
Jan. 17
27%
14%
19%
20%
24%
3%
Arizona
Rocky Mtn Poll
Mar. 21
27%
20%
9%
25%
34%
11%
Arizona
Arizona State U.
Feb. 25
28%
24%
14%
25%
44%
6%
Arizona
ARG
Feb. 13
33%
24%
13%
21%
45%
2%
Arizona
Rocky Mtn Poll
Jan. 22
32%
15%
18%
13%
40%
11%
Arkansas
ARG
Mar. 23
49%
16%
12%
12%
21%
4%
Arkansas
ARG
Mar. 19
49%
16%
12%
12%
21%
4%
California
SurveyUSA
Mar. 6
44%
31%
10%
41%
23%
8%
California
Datamar
Feb. 15
34%
24%
16%
41%
17%
11%
California
ARG
Jan. 17
36%
33%
6%
33%
18%
3%
Connecticut
Quinnipiac U.
Feb. 12
33%
21%
5%
43%
27%
4%
Connecticut
ARG
Feb. 6
40%
8%
10%
32%
21%
14%
Delaware
FDU
Feb. 25
34%
19%
10%
0%
0%
0%
Florida
Quinnipiac U.
Mar. 4
38%
13%
6%
38%
18%
6%
Florida
Quinnipiac U.
Feb. 4
49%
13%
7%
29%
23%
6%
Florida
ARG
Jan. 9
30%
14%
15%
30%
15%
2%
Illinois
ARG
Jan. 14
30%
36%
5%
33%
24%
12%
Iowa
U. of Iowa
Mar. 31
28%
19%
34%
21%
20%
17%
Iowa
ARG
Mar. 23
34%
16%
33%
29%
29%
10%
Iowa
ARG
Mar. 22
34%
33%
16%
29%
29%
10%
Iowa
Zogby
Feb. 9
24%
24%
18%
19%
17%
5%
Iowa
Zogby
Jan. 16
16%
27%
17%
19%
17%
5%
Maine
ARG
Feb. 6
41%
14%
17%
33%
22%
13%
Massachusetts
ARG
Feb. 6
35%
24%
19%
29%
30%
7%
Michigan
ARG
Mar. 4
35%
30%
14%
30%
35%
0%
Michigan
EPIC/MRA
Feb. 4
49%
20%
8%
32%
28%
8%
Michigan
ARG
Jan. 7
30%
30%
17%
34%
24%
10%
Missouri
ARG
Jan. 9
30%
18%
17%
18%
31%
2%
Nevada
Susquehanna
Mar. 9
32%
17%
16%
34%
19%
19%
Nevada
Research 2000
Mar. 8
32%
20%
11%
38%
18%
4%
New Hampshire
ARG
Mar. 23
37%
23%
20%
19%
23%
17%
New Hampshire
Franklin Pierce Coll.
Mar. 12
32%
25%
16%
28%
29%
22%
New Hampshire
Suffolk U.
Feb. 28
28%
26%
17%
37%
27%
17%
New Hampshire
Zogby/UNH
Feb. 8
27%
23%
13%
27%
28%
13%
New Hampshire
Zogby
Jan. 17
19%
19%
23%
20%
26%
13%
New Jersey
FDU
Mar. 4
46%
18%
10%
59%
20%
6%
New Jersey
Quinnipiac U.
Feb. 25
41%
19%
5%
58%
15%
2%
New Jersey
Quinnipiac U.
Jan. 22
30%
8%
16%
39%
21%
5%
New Mexico
ARG
Feb. 13
22%
17%
12%
38%
20%
7%
New York
Siena Coll.
Mar. 22
43%
11%
7%
31%
20%
6%
New York
Quinnipiac U.
Feb. 11
47%
16%
7%
51%
17%
1%
North Carolina
ARG
Jan. 15
26%
19%
30%
34%
26%
2%
Ohio
Quinnipiac U.
Mar. 19
32%
22%
11%
31%
20%
6%
Ohio
Quinnipiac U.
Mar. 4
32%
19%
13%
35%
18%
3%
Ohio
U. of Akron
Feb. 21
42%
16%
17%
36%
28%
6%
Ohio
Quinnipiac U.
Jan. 28
38%
11%
13%
30%
22%
4%
Oklahoma
ARG
Feb. 13
40%
15%
16%
37%
21%
2%
Oregon
Riley Research
Mar. 13
31%
21%
8%
33%
20%
5%
Pennsylvania
Quinnipiac U.
Mar. 4
29%
18%
11%
43%
17%
6%
Pennsylvania
Susquehanna
Feb. 20
42%
16%
11%
37%
29%
6%
Pennsylvania
Quinnipiac U.
Feb. 5
37%
11%
11%
30%
20%
4%
Pennsylvania
ARG
Jan. 8
32%
12%
13%
35%
25%
1%
Rhode Island
Brown U.
Jan. 27
33%
8%
15%
0%
0%
0%
South Carolina
ARG
Feb. 27
36%
25%
20%
29%
35%
5%
Texas
ARG
Mar. 23
34%
32%
11%
30%
20%
13%
Texas
ARG
Mar. 19
34%
32%
11%
30%
20%
13%
Utah
ARG
Feb. 13
31%
18%
9%
13%
21%
40%
Vermont
ARG
Feb. 6
37%
19%
14%
29%
30%
7%
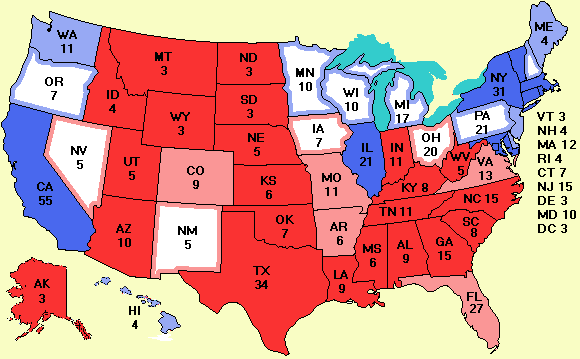
This page is the prototype for 2008. The data and map will refer to previous
elections until serious polls begin in 2008. The blog will be updated when
there is interesting news about the 2008 races.