
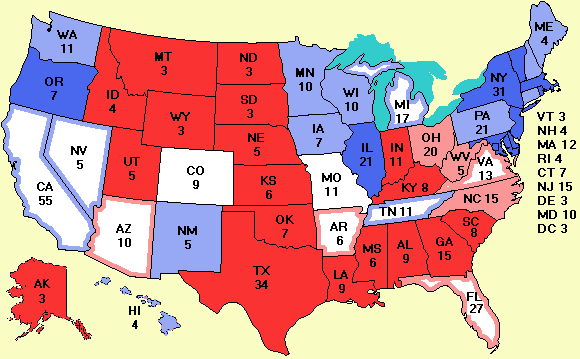
Electoral Vote Predictor 2004: Kerry 280 Bush 238
|
|


| Aug. 26 | New polls: FL IN ME MI NJ WA |
 |
News from the Votemaster
There are six new polls today, including Florida and Michigan. Rasmussen confirms Gallup's result that Bush is a fraction ahead there, 49% to 47%, with Nader at 2%. Kerry maintains his small lead in Michigan 48% to 45%. The other polls don't change anything either.
A number of Senate races have been updated today. The most interesting result is in that always politically-fascinating state, Florida. With the senatorial primary coming up next Tuesday, it now looks like Betty Castor (D) vs. Bill McCollum (R), although the Republican race is still tight.
Quite a few people have looked at yesterday's map and observed that it is easy to devise a scenario in which the electoral college is tied. They have asked me what happens then? Since this question is asked a lot, I have added it to the FAQ.
If you haven't seen the Jib Jab movie yet, by all means look at it. It is very funny and pokes fun at both Bush and Kerry.
Now some news about the site. Time for a contest. I am looking for a favicon.ico, the little icon next to a name on the IE Favorites list. With 80,000 to 90,000 visitors a day now, there are bound to be a few graphic designers among them. If you want to enter an icon into the Great Electoral Vote Predictor Icon Contest, send it to me in the standard Windows .ico format before midnight, Friday Sep. 3. The prize is a listing in the acknowledgments section of the Welcome page. Thousands of people will see this and it will probably bring quite a bit of traffic to your site.
Finally, we have an improvement to the site. By popular demand, 'Grumpy' has added a linear regression line to the state polls. Here are some important facts to know about the lines.
- The lines are computed using the least squares method
- The lines are based on polls completed in the previous 90 days
- Although the points are plotted on the day we reported the poll, the lines use the actually polling dates
- If fewer than three polls are available in the previous 90 days, the current value is extrapolated to November
- When there are few polls available or they are inconsistent, the results will be weird
- As we approach election day, the quality of the predictions will improve
- Do not believe everything you see on the Internet
For each line, an error bar is shown on Nov. 2. Is was generated by computing the deviation of each poll from the line, squaring the deviation, adding up the squared deviations for al the polls, computing the average squared deviation, and then taking the square root of the average squared deviation. This metric is commonly used by statisticians and shows how well the line fits the data. A small error bar means a good fit. A large error bar means a bad fit. The error bars are NOT a margin of error as in the polls themselves and are certainly not a good measure of who is going to carry the state.
As an example of the pitfalls in this kind of modeling, consider Missouri Currently it is tied. But in mid June, Kerry was way down. The computer (correctly) sees that Kerry has made huge progress in the past 2 months in Missouri and thus extrapolates he will continue to make huge progress there in the next 2 months. If you know that Kerry was polling 37% two months ago and is at 47% now, based only on this data, it is correct to predict that he will be at 57% in two more months. There is nothing wrong with the software. This kind of prediction is inherent when the data are sporadic, noisy, and rapidly changing. Of course one could make more sophisticated mathematical models, but there are an infinite number of possible models and one could have endless arguments about which is best. As we approach election day, the kind of effect will become much smaller. For the moment, don't take the extrapolations too seriously.
The volume of mail has increased to the point where I simply cannot answer it all any more. It was taking 4-5 hours a day. I will still read it all, though. Short, clear questions that are germane to the election have the best chance of getting an answer. E-mails starting "Dear Babykiller" have the least chance of getting an answer. Be sure to read the Welcome page and the FAQ. A lot of common questions are answered there. I do apologize for having to be so impolite.
To bookmark this page, type CTRL-D. If you are visiting for the first time, welcome. This site has far more about the election than just the map. See the Welcome page for more details.
|
|
