Cook Releases New Partisan Voting Index Table
Permalink
Political guru Charlie Cook has now
released
the new PVI (Partisan Voting Index) based on the 2004 and 2008
elections. The PVI is by congressional district and tells how much more Democratic or Republican a district
is than the country as a whole based on the two previous presidential elections. For example, Jose Serrano's
NY-16 district and Charlie Rangel's NY-15 district are both D+41, meaning that these districts voted Democratic
by 41% more than the country as a whole averaged over 2004 and 2008. Similarly, Spencer Bachus in AL-06 and
Mac Thornberry in TX-13 represent R+29 districts, meaning the average vote for Bush (2004) and McCain exceeded
that of Kerry and Obama by 29%. These four are the most extreme districts in the country.
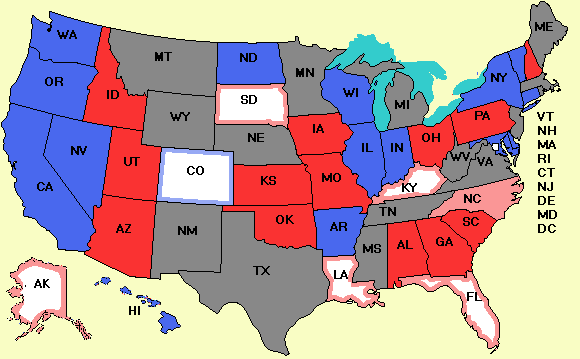
Here is Cook's map of the country by PVI.
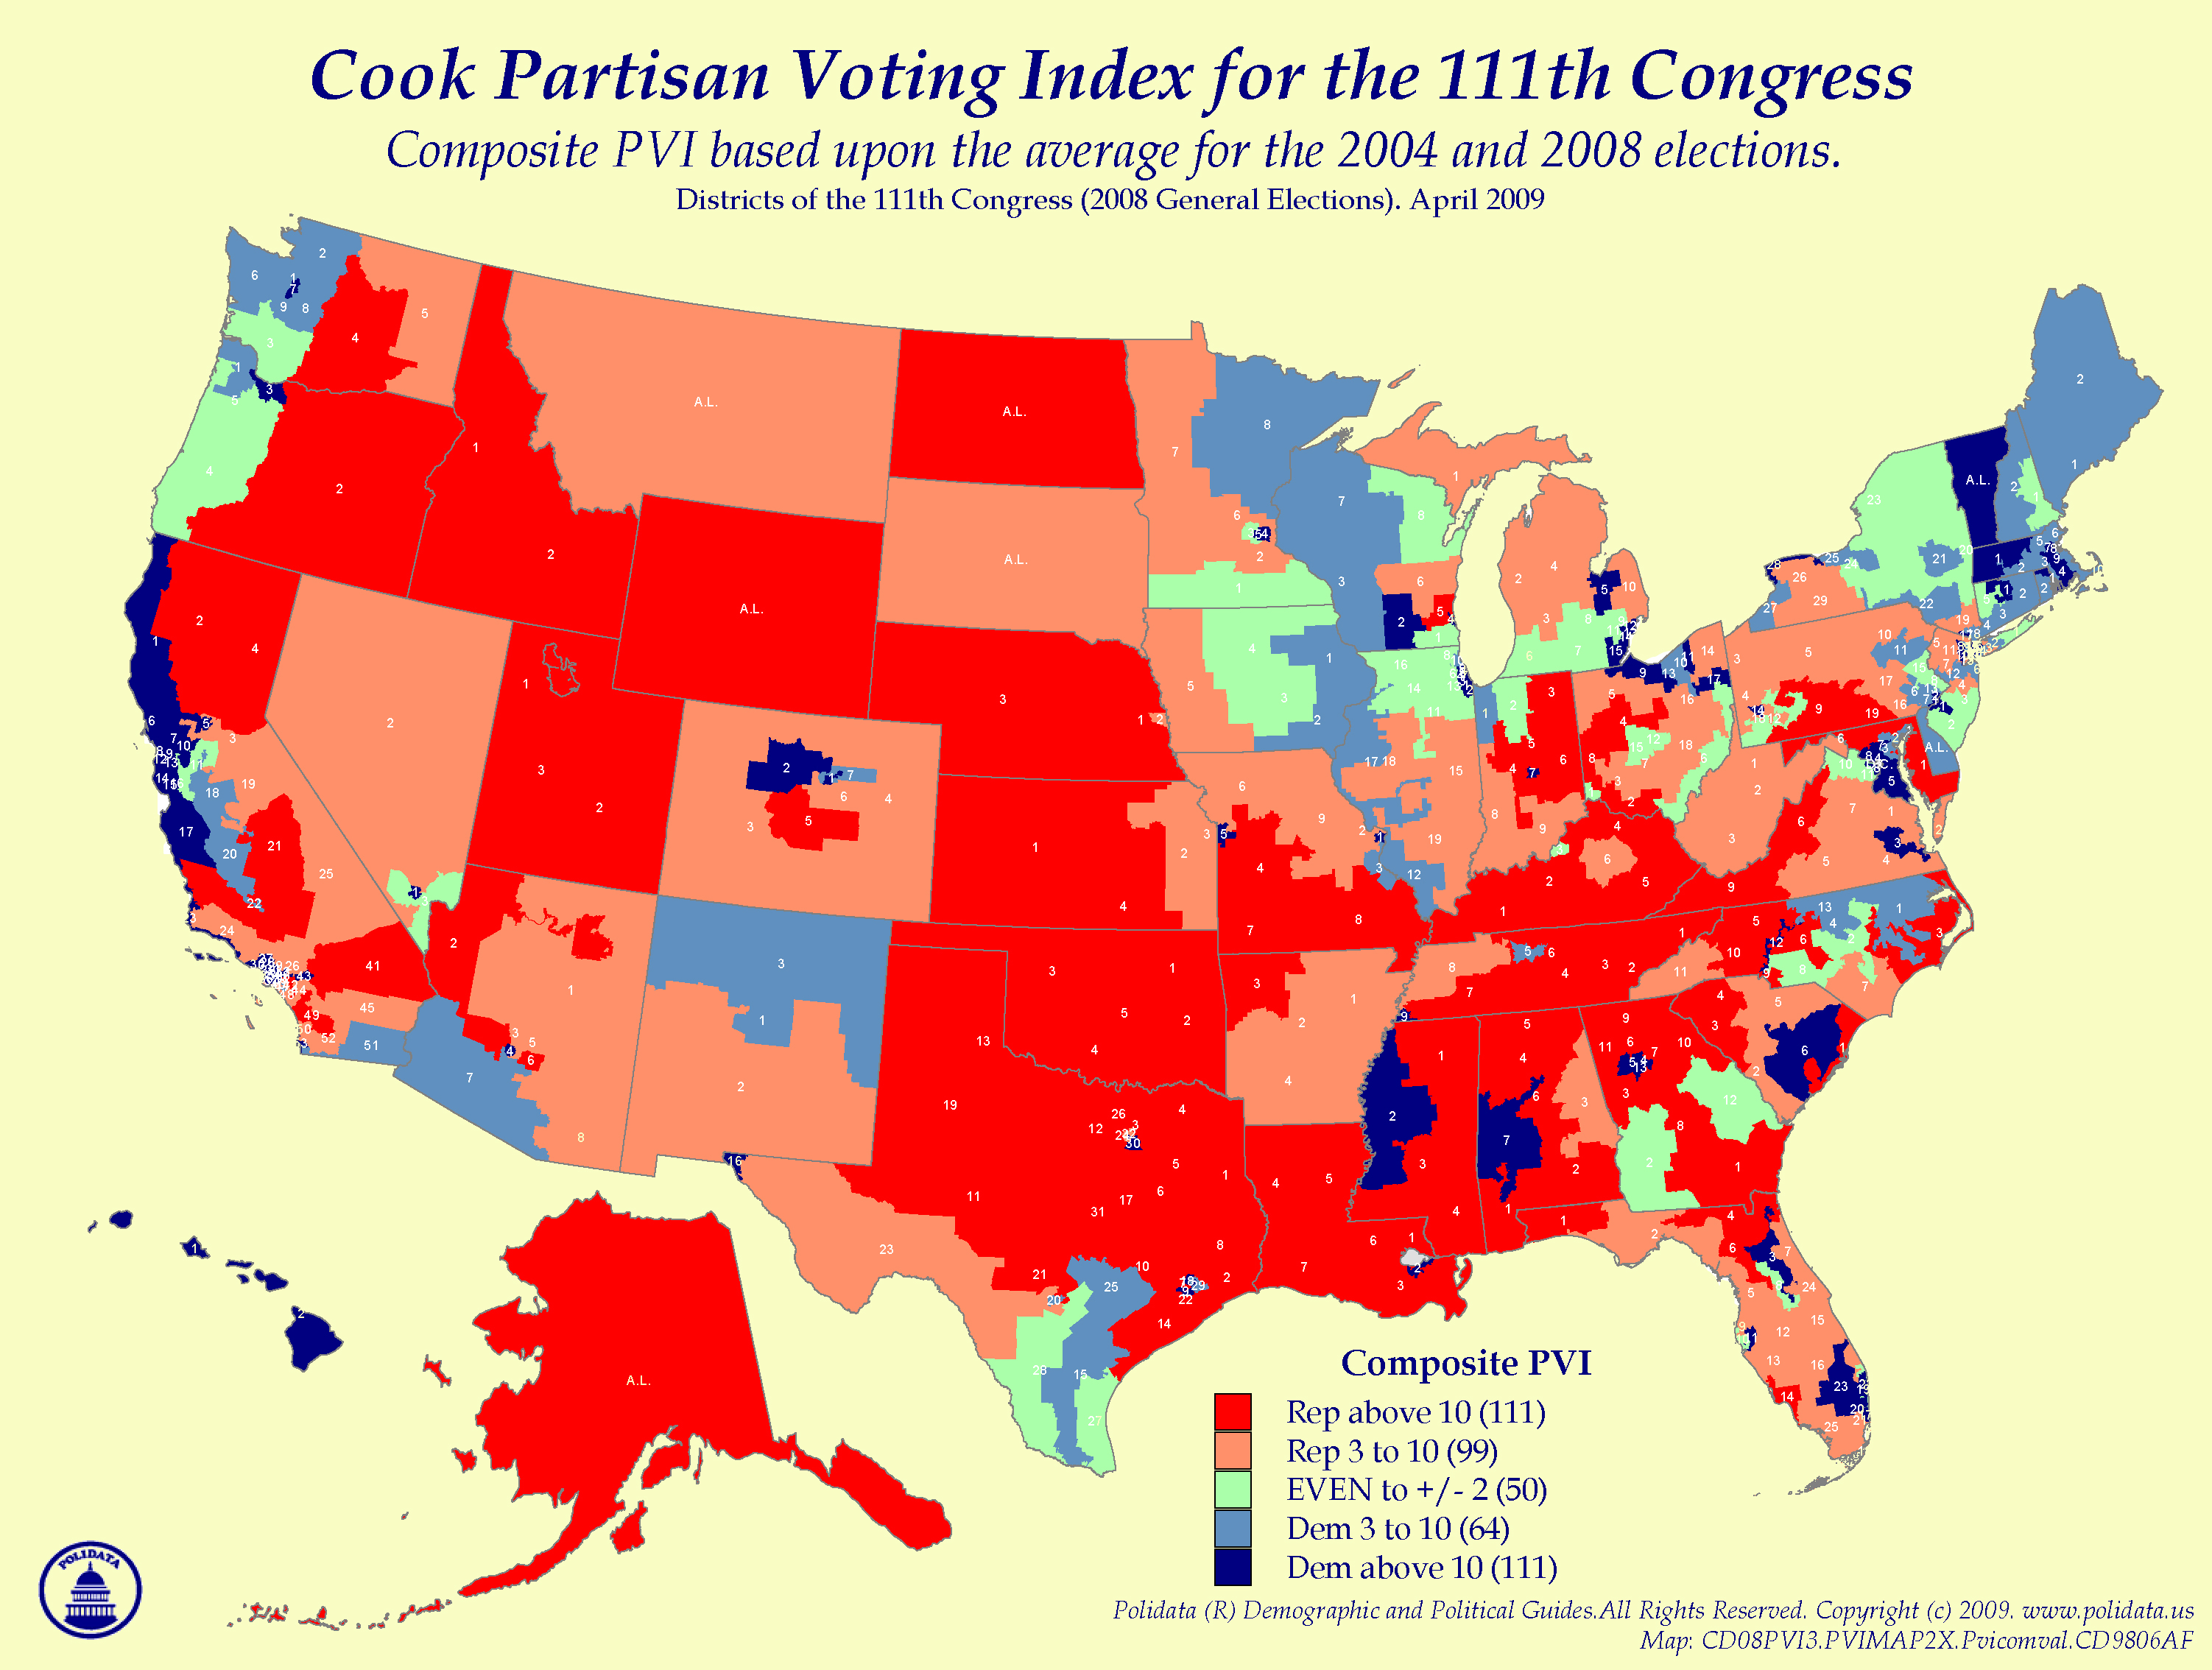
Here is the map at full resolution.
In addition, we have put the data in both
Excel format
and
.csv format
so you can download and play with it.
The spreadsheets list the current incumbent and his or her party, so you can make lists of Democrats in Republican
districts (68) or Republicans in Democratic districts (8). This enormous imbalance accounts for the large Blue Dog
caucus in the House. There are many conservative Democrats from conservative Republican districts who are leery
of being labeled a "liberal." The reverse is hardly true at all.
From this mountain of data, Cook has extract all kinds of trends. The most noteworthy are (1) there are far
fewer swing districts than there used to be and (2) Democrats now occupy the seats in most of the former swing
districts. Real political junkies will want to read his article. It has been placed on the Data galore page
listed on the menu below the map so you can find it later easily.
Swing State Project also has a story
on the new PVIs.
Tied Elections on the Rise
Permalink
Politico has a
story
on the seemingly endless stream of very close elections, such as the Minnesota Senate race and now NY-20.
In 2008, nine House and Senate races were not decided on election night and there were 21 House races in
which the winner got less than 51%. How come? Probably the real (but generally unspoken) reason is that
with modern polling and computerized data bases, the Republicans move just as far to the left as they
have to in order to get 50.1% of the vote and Democrats move just as far to the right as they have to in order
to get 50.1%. In the past candidates could not calibrate how far that was very accurately, but now a
candidate can change one position minutely and see exactly how many tenths of a percent that moved the
balance. Also, litigating close elections used to be seen as being a poor loser. Now it is part of the business.
If you like this Website, tell your friends. You can also share by clicking this button

-- The Votemaster
|