The blue bars show the number of Democrats in the Senate after the election in the year given. The red bars show the numbers of Republicans. The numbers show the post-election seats for each party. The black lines show how many seats each party had prior to the election. Third party seats are not counted. The background color shows which party controlled the White House at the time of the election. Popular election of senators began in 1914.
| 2000s | 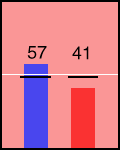 2008 Bush |
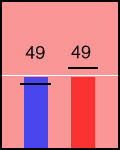 2006 Bush |
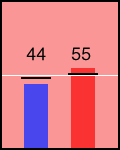 2004 Bush |
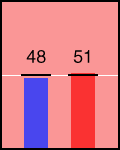 2002 Bush |
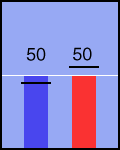 2000 Clinton |
| 1990s | 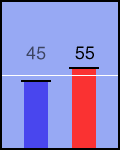 1998 Clinton |
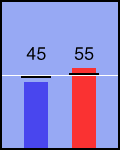 1996 Clinton |
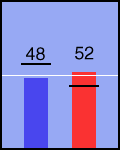 1994 Clinton |
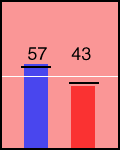 1992 Bush |
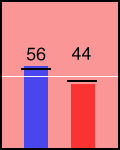 1990 Bush |
| 1980s | 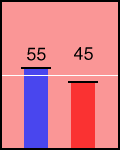 1988 Reagan |
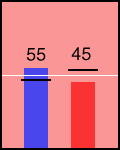 1986 Reagan |
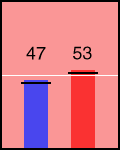 1984 Reagan |
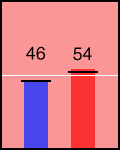 1982 Reagan |
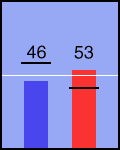 1980 Carter |
| 1970s | 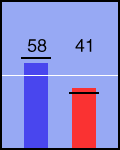 1978 Carter |
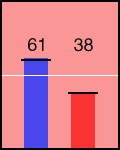 1976 Ford |
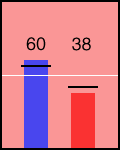 1974 Ford |
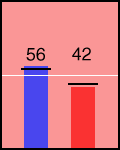 1972 Nixon |
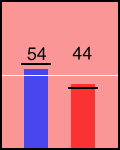 1970 Nixon |
| 1960s | 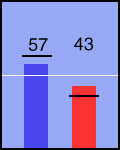 1968 Johnson |
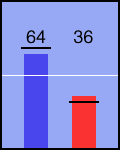 1966 Johnson |
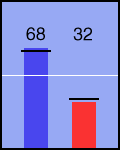 1964 Johnson |
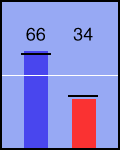 1962 Kennedy |
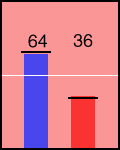 1960 Eisenhower |
| 1950s | 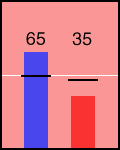 1958 Eisenhower |
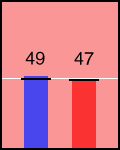 1956 Eisenhower |
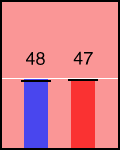 1954 Eisenhower |
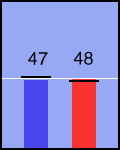 1952 Truman |
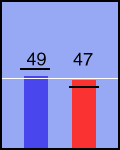 1950 Truman |
| 1940s | 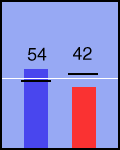 1948 Truman |
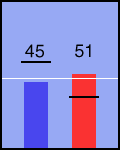 1946 Truman |
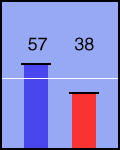 1944 Roosevelt |
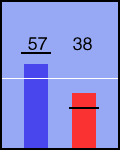 1942 Roosevelt |
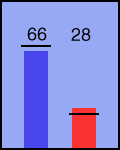 1940 Roosevelt |
| 1930s | 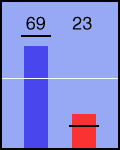 1938 Roosevelt |
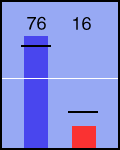 1936 Roosevelt |
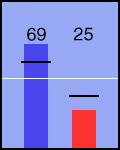 1934 Roosevelt |
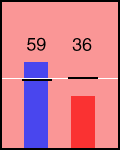 1932 Roosevelt |
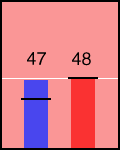 1930 Hoover |
| 1920s | 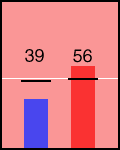 1928 Hoover |
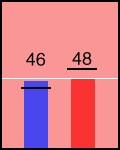 1926 Coolidge |
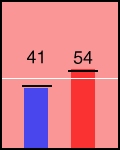 1924 Coolidge |
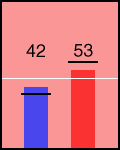 1922 Harding |
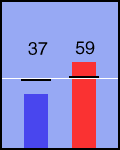 1920 Harding |
| 1910s | 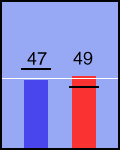 1918 Wilson |
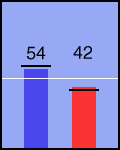 1916 Wilson |
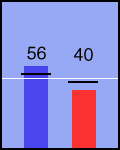 1914 Wilson |
