Presidential polls: CA MA
Dem pickups: MO
GOP pickups: FL IN NC OH
Previous | Next
Senate
Downloadable data
 Welcome
 FAQs
FAQs Electoral vote graphs
 Graphs of all polls
 Current score by state
 Icons for bloggers
 Data galore
 Donations
News from the Votemaster
Dismal Jobs Report for May
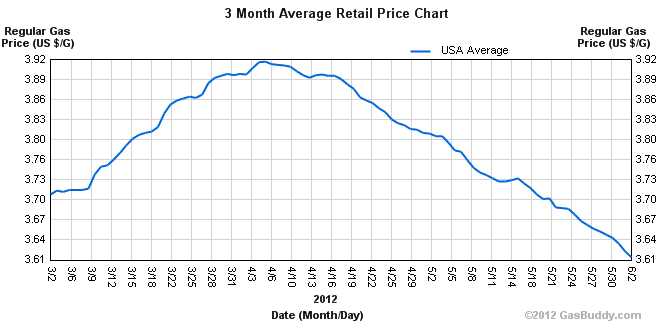
The economy added just 69,000 jobs in May, worse than expected. Mitt Romney jumped on this and said Obama can't manage the economy. When times are bad, people blame the President. When times are good, Presidents try to take credit for it. In most cases, the President really has little power to affect things. A month ago, Romney was blaming Obama for gas prices of almost $4/gallon. Now that gas prices have dropped sharply to an average of $3.62, he never mentions the subject any more. Here is a chart of gas prices for the past 3 months from gasbuddy.com.
The reality is that no President can micromanage gas prices, jobs, or any other aspect of the economy. Market forces determine these things. But that doesn't stop politicians from assigning blame and taking credit for things they can't control. Roosters probably tell their friends that only through their heroic efforts did the sun rise that day.
That said, it doesn't mean the President has no effect on the economy. He does, but only in a very indirect way. When Obama pushed for the $830 billion stimulus bill in 2009, most economists said it was much too small to get the economy moving again. Nevertheless, Obama did not push for a bigger injection because he was afraid the Republicans would call it a trillion-dollar boondoggle. Listening to his political advisors instead of his economists may prove to be his undoing in November.
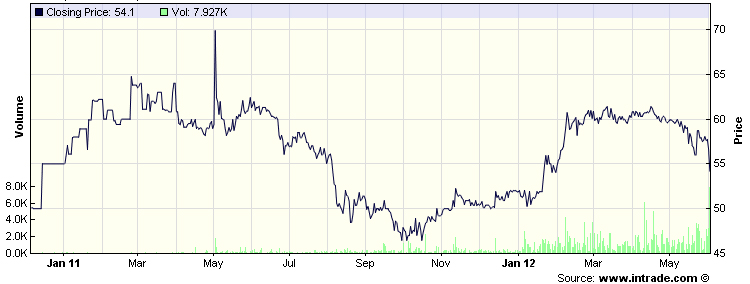
The amount of damage the jobs report has done to Obama is hard to say. Temporarily, a fair amount, but the September report is far more important since by then people will have long forgotten the May report. For what it is worth, here is the Intrade price chart for Obama to win the general election. He lost about 3 points as a result of the jobs report, but is still slightly favored.
The stock market didn't take the news well either. The Dow was off 274 points or 2.2%. The S&P 500 and Nasdaq were down by 2.5% and 2.8%, respectively. All in all, a bad day for the economy and thus a bad day for Obama and a good day for Romney.
Tipping-Point Table Revisited
There is apparently some confusion about the new tipping-point table reachable by clickong on "Current score by state" link in the menu. A number of people expected the sum of Obama's EVs and Romney's EVs on each line to be 538. That's actually not the case. Look at today's table. Suppose, for simplicity, Obama were to win only the states where his lead is now 20% or more, D.C. through and including Illinois. The fifth column shows he would get 72 electoral votes in that case. Reading from the bottom, Romney would then win all the states from Oklahoma through and including California (not not Illinois), giving him 466 electoral votes--the score in the highest row he won, namely California. Adding 72 and 466 we do get 538. In fact, if you take Obama's score in any row and add to it Romney's score in the row below it, you do get 538. To add up the Obama and Romney scores in the same row counts that state for both of them. Hope this is clear now.
Presidential Polls
| State | Obama | Romney | Start | End | Pollster | |
| California | 48% | 32% | May 21 | May 29 | Field Poll | |
| Massachusetts | 46% | 34% | May 25 | May 31 | U. of New Hampshire | |
| Massachusetts | 59% | 34% | May 20 | May 22 | Suffolk U. |
Senate Polls
| State | Democrat | D % | Republican | R % | I | I % | Start | End | Pollster |
| Massachusetts | Elizabeth Warren | 37% | Scott Brown | 39% | May 25 | May 31 | U. of New Hampshire |