Electoral College Graphs 2008

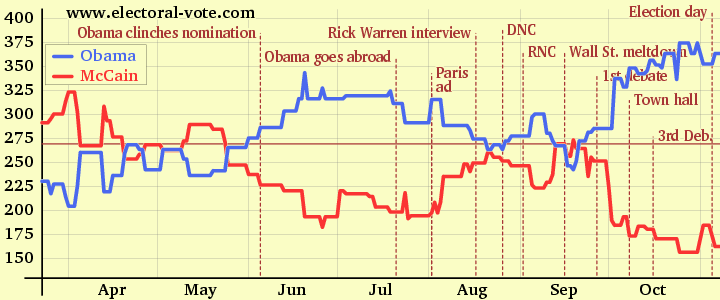
The graph above shows the current number of electoral votes for each candidate since Mar 22, The brown horizontal line shows the 270 electoral vote mark needed to be elected president. The gray vertical lines show the boundaries between the months.

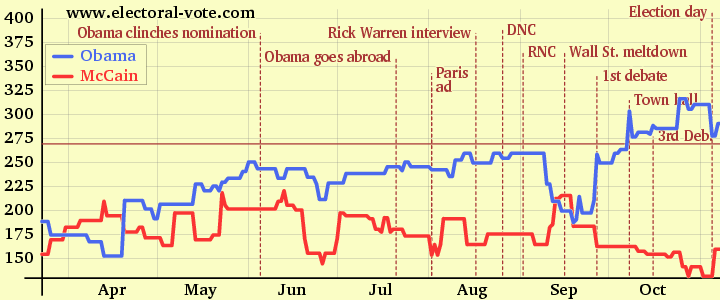
The graph above shows the electoral votes again but omits the "barely" states. The electoral votes of a state only count in this graph if the candidate has a margin of 5% or more over his opponent.
Electoral College Graphs 2004

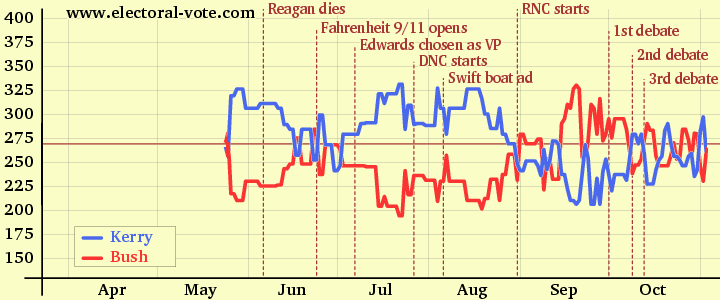
The graph above shows the current number of electoral votes for each candidate since May 24, The brown horizontal line shows the 270 electoral vote mark needed to be elected president. The gray vertical lines show the boundaries between the months.

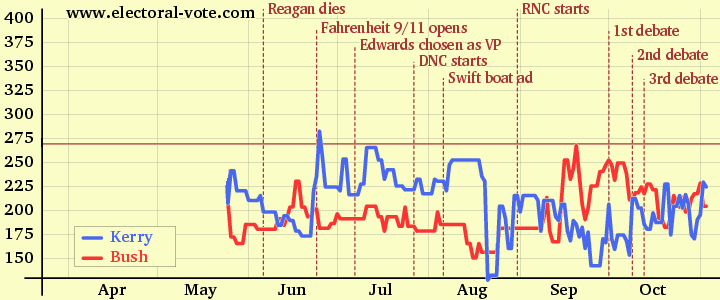
The graph above shows the electoral votes again but omits the "barely" states. The electoral votes of a state only count in this graph if the candidate has a margin of 5% or more over his opponent.
Back to the main page.