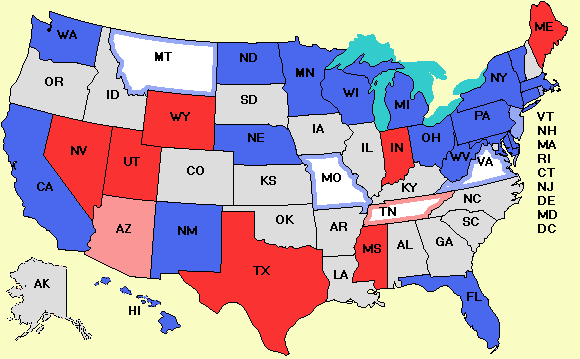
New Senate: 51 Democrats 49 Republicans
|
|
| Nov. 13 | Pickups: | Missouri, Montana, Ohio, Pennsylvania, Rhode Island, Virginia | |
News from the Votemaster
Yesterday we looked at how well the Senate pollsters did. Today we will look at the House pollsters. Below is a table that gives the final vote in column 2, followed by the results of 5 pollsters. Each cell consists of the Democratic percentage minus the Repubican percentage. For example, in AR-02, the Democrat - Republican value is 22, meaning the Democrat won by 22%. The last poll from SurveyyUSA predicted a Democratic win by 21%. The data is available in .csv format.
| CD | Vote | M-D | Research 2000 | RT Strategies | SurveyUSA | Zogby |
| AR-02 | 22 | 21 | ||||
| AZ-01 | -9 | -3 | ||||
| AZ-05 | 5 | 2 | ||||
| AZ-08 | 12 | 12 | ||||
| CA-04 | -5 | 0 | -7 | |||
| CA-11 | 4 | 2 | ||||
| CA-26 | -32 | -19 | ||||
| CA-48 | -31 | -19 | ||||
| CA-50 | -17 | -14 | ||||
| CO-03 | 27 | 19 | ||||
| CO-04 | -3 | -10 | 3 | |||
| CO-05 | -20 | -7 | -9 | |||
| CO-07 | 13 | 6 | 5 | 16 | 14 | |
| CT-02 | 0 | 1 | 6 | -5 | ||
| CT-04 | -3 | 4 | -9 | 7 | ||
| CT-05 | 12 | 3 | 8 | |||
| FL-05 | -20 | -14 | ||||
| FL-09 | -12 | -12 | ||||
| FL-13 | 0 | 2 | ||||
| FL-16 | 1 | 7 | 3 | |||
| FL-22 | 4 | -5 | 2 | 9 | ||
| FL-24 | -14 | -2 | ||||
| IA-01 | 12 | 7 | ||||
| IA-02 | 2 | -2 | ||||
| IA-03 | 6 | 12 | ||||
| ID-01 | -5 | -2 | ||||
| IL-06 | -4 | 1 | 14 | |||
| IL-08 | 5 | 5 | ||||
| IL-10 | -6 | 2 | ||||
| IN-02 | 8 | 3 | 3 | 13 | ||
| IN-03 | -10 | -12 | ||||
| IN-07 | 8 | 5 | ||||
| IN-08 | 22 | 7 | 10 | |||
| IN-09 | 3 | 2 | 8 | -2 | 2 | |
| KY-03 | 3 | 6 | 5 | |||
| KY-04 | -9 | 4 | -6 | 3 | ||
| MN-01 | 6 | -3 | ||||
| MN-02 | -18 | -8 | ||||
| MN-05 | 35 | 25 | ||||
| MN-06 | -8 | -1 | -7 | -10 | ||
| MT-AL | -10 | -24 | ||||
| NC-08 | 0 | 4 | ||||
| NC-11 | 8 | 9 | 5 | |||
| NH-01 | 2 | -8 | ||||
| NH-02 | 8 | -1 | 3 | |||
| NJ-07 | -1 | -3 | ||||
| NM-01 | 0 | 2 | 9 | |||
| NV-02 | -4 | -8 | -8 | |||
| NV-03 | -1 | -7 | -7 | |||
| NY-03 | -12 | -7 | ||||
| NY-19 | 2 | 2 | ||||
| NY-20 | 6 | 11 | ||||
| NY-25 | -2 | 9 | ||||
| NY-26 | -4 | -4 | -1 | |||
| NY-29 | -2 | 11 | ||||
| OH-01 | -6 | 2 | ||||
| OH-02 | -2 | -5 | -8 | |||
| OH-06 | 22 | 19 | ||||
| OH-02 | -6 | -5 | ||||
| OH-18 | 24 | 20 | ||||
| OK-05 | -24 | -22 | ||||
| PA-04 | 5 | -4 | ||||
| PA-06 | -2 | 5 | 5 | |||
| PA-08 | 1 | 3 | ||||
| SC-05 | 14 | 19 | ||||
| SD-AL | 41 | 40 | ||||
| TX-22 | 10 | 8 | ||||
| VA-02 | -2 | -2 | 5 | -8 | ||
| VA-05 | -19 | -26 | ||||
| VT-AL | 8 | 10 | ||||
| WA-02 | 32 | 29 | ||||
| WA-05 | -10 | -5 | ||||
| WA-08 | 0 | 2 | 0 | |||
| WI-08 | 2 | 6 | ||||
| WY-AL | 0 | -7 |
To see how well a pollster did, we can subtract the actual vote from the prediction. For example, in the table below, if we subtract from SurveyyUSA's prediction for AR-02 (21) the actual vote total (22) we get -1. In other words, Mason-Dixon predicted that the Democrat would do 1% worse than he actually did. A perfect pollster would have a column consisting entirely of 0s. Since the margin of error in predicting each candidate's score is about 4%, the margin of error in predicting the difference is about 8%. Thus to a first approximation, any number less than or equal to 8 should be considered a correct prediction. Anything more than 8 is wrong. However, using the standard 95% level of confidence, about 1 in 20 polls should be "wrong." A negative number means the Democrat did better than expected. A positive one means the Democrat did worse than expected.
| CD | M-D | Research 2000 | RT Strategies | SurveyUSA | Zogby |
| AR-02 | -1 | ||||
| AZ-01 | 6 | ||||
| AZ-05 | -3 | ||||
| AZ-08 | 0 | ||||
| CA-04 | 5 | -2 | |||
| CA-11 | -2 | ||||
| CA-26 | 13 | ||||
| CA-48 | 12 | ||||
| CA-50 | 3 | ||||
| CO-03 | -8 | ||||
| CO-04 | -7 | 6 | |||
| CO-05 | 13 | 11 | |||
| CO-07 | -7 | -8 | 3 | 1 | |
| CT-02 | 1 | 6 | -5 | ||
| CT-04 | 7 | -6 | 10 | ||
| CT-05 | -9 | -4 | |||
| FL-05 | 6 | ||||
| FL-09 | 0 | ||||
| FL-13 | 2 | ||||
| FL-16 | 6 | 2 | |||
| FL-22 | -9 | -2 | 5 | ||
| FL-24 | 12 | ||||
| IA-01 | -5 | ||||
| IA-02 | -4 | ||||
| IA-03 | 6 | ||||
| ID-01 | 3 | ||||
| IL-06 | 5 | 18 | |||
| IL-08 | 0 | ||||
| IL-10 | 8 | ||||
| IN-02 | -5 | -5 | 5 | ||
| IN-03 | -2 | ||||
| IN-07 | -3 | ||||
| IN-08 | -15 | -12 | |||
| IN-09 | -1 | 5 | -5 | -1 | |
| KY-03 | 3 | 2 | |||
| KY-04 | 13 | 3 | 12 | ||
| MN-01 | -9 | ||||
| MN-02 | 10 | ||||
| MN-05 | -10 | ||||
| MN-06 | 7 | 1 | -2 | ||
| MT-AL | -14 | ||||
| NC-08 | 4 | ||||
| NC-11 | 1 | -3 | |||
| NH-01 | -10 | ||||
| NH-02 | -9 | -5 | |||
| NJ-07 | -2 | ||||
| NM-01 | 2 | 9 | |||
| NV-02 | -4 | -4 | |||
| NV-03 | -6 | -6 | |||
| NY-03 | 5 | ||||
| NY-19 | 0 | ||||
| NY-20 | 5 | ||||
| NY-25 | 11 | ||||
| NY-26 | 0 | 3 | |||
| NY-29 | 13 | ||||
| OH-01 | 8 | ||||
| OH-02 | -3 | -6 | |||
| OH-06 | -3 | ||||
| OH-02 | 1 | ||||
| OH-18 | -4 | ||||
| OK-05 | 2 | ||||
| PA-04 | -9 | ||||
| PA-06 | 7 | 7 | |||
| PA-08 | 2 | ||||
| SC-05 | 5 | ||||
| SD-AL | -1 | ||||
| TX-22 | -2 | ||||
| VA-02 | 0 | 7 | -6 | ||
| VA-05 | -7 | ||||
| VT-AL | 2 | ||||
| WA-02 | -3 | ||||
| WA-05 | 5 | ||||
| WA-08 | 2 | 0 | |||
| WI-08 | 4 | ||||
| WY-AL | -7 |
Projected New House: 230 Democrats 197 Republicans 8 Ties
Dem pickups: AZ-05 AZ-08 CA-11 CO-07 CT-05 FL-16 FL-22 IA-01 IA-02 IN-02 IN-08 IN-09 KS-02 KY-03 MN-01 NC-11 NH-01 NH-02 NY-19 NY-20 NY-24 OH-18 PA-04 PA-07 PA-08 PA-10 TX-22 WI-08
GOP pickups:
If you like this site, please announce it to news groups and blogs and tell your friends about it. If you have your own blog, please click on "For bloggers" above.
-- The Votemaster