South Carolina Polls
 |
| |
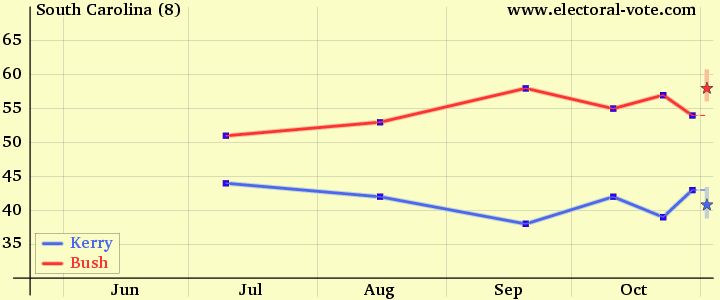
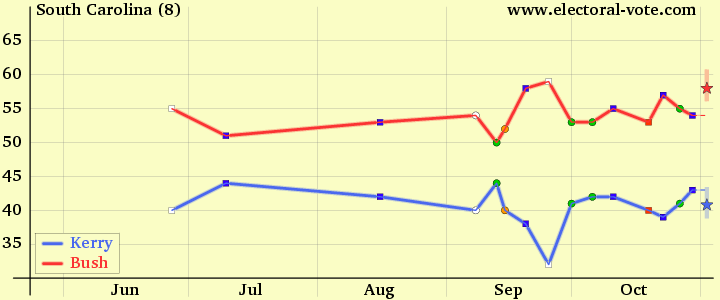
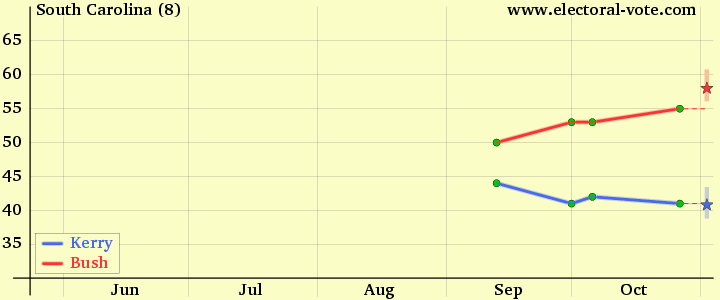
The y axis is the percentage of the voters who said they would vote for the candidate.
Every point is plotted on the middle date of its poll.
The bands just after election day show the exit polls and their MoEs. The stars indicate the final results.
For additional state polls, click on a state abbreviation:
AL
AK
AZ
AR
CA
CO
CT
DE
DC
FL
GA
HI
ID
IL
IN
IA
KS
KY
LA
ME
MD
MA
MI
MN
MS
MO
MT
NE
NV
NH
NJ
NM
NY
NC
ND
OH
OK
OR
PA
RI
SC
SD
TN
TX
UT
VT
VA
WA
WV
WI
WY
w1:
Rasmussen
 w1:
w1:Survey USA