| Nov. 06 | |
|
|
|
|
| ||||||||||||||||||||||||
| Presidential polls today: | (None) | |
||
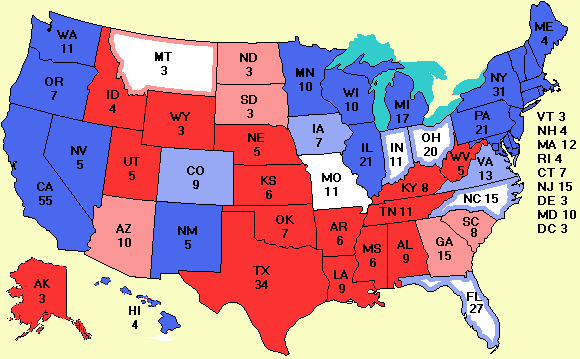
| Dem pickups (vs. 2004): | CO FL IN IA NV NM NC OH VA | GOP pickups (vs. 2004): | (None) |
|
|
News from the Votemaster
Popular Vote TotalsIf you are looking for the popular vote totals for all candidates (including third parties), here is a link. Exit PollsThe NY Times has the exit poll data. Obama barely won among men (49% to 48%), but strongly among women (56% to 43%), overwhelmingly among blacks (95% to 5%), and convincingly among Latinos (66% to 31%) and Asians (62% to 35%). However, he lost among whites (43% to 55%) as Democrats normally do. He did progressively worse with age, winning the 18-29 year-olds 66% to 31% but losing seniors 52% to 46%. He swept every educational category as well as Catholics and Jews but lost Protestants 54% to 45%. He won people living in big cities, small cities, and suburbs, but lost in small towns and rural areas. One is tempted to say McCain won in traditional 19th century America (what Sarah Palin would call "real America"): older white Protestant men living in small towns. Obama won everywhere else. The Republican Party is going to have to think long and hard if it wants to hitch its wagon to this fading star while the Democrats are going after younger, multicultural, urban voters. State of the SenateAs Yogi Berra so aptly put it: "It ain't over 'till it's over." Well, the battle for the Senate ain't over. The Oregonian now projects that state house speaker Jeff Merkley will defeat Sen. Gordon Smith (R-OR) in their Senate race. Merkley now leads by 4000 votes and most of the remaining votes are from heavily Democratic Multnomah County. In Minnesota, Sen. Norm Coleman (R-MN) leads challenger Al Franken by 570 votes out of 2.5 million cast. There will be a recount, which could take weeks according to Minnesota secretary of state Mark Richie. Alaska has another Senate race whose winner is in doubt. At present, Sen. Ted Stevens (R-AK) holds a 4000-vote lead over Anchorage mayor Mark Begich. However, 4% of the precincts haven't reported yet and there are 70,000 absentee ballots yet to be counted. A Stevens victory could have national implications, however, as Democrats will likely try to expel the convicted senator from the Senate if he wins and Republicans would be forced to make a difficult vote on the expulsion motion. If he is expelled, there will be a special election to fill the seat and many people expect Sarah Palin to run and win, giving her four years of national exposure before a possible 2012 run for the White House. Not all Republicans are happy at seeing someone with such high unfavorables and who was repeatedly mocked as a lightweight with expensive taste in designer clothing becoming the de facto party leader. Once you have acquired a bad public image, it is hard to shake it. Just ask President Quayle. Finally, in Georgia, Sen. Saxby Chambliss (R-GA) beat Jim Martin(D) in the Senate race there, but may not have gotten the requisite 50% of the vote, forcing a runoff there in December. All in all, the Democrats still have some opportunities to raise their Senate totals to the 57-58 seat range, but getting a filibuster-proof 60 now seems out of the question unless Obama appoints to the cabinet one or more Republican senators from states with Democratic governors. State of the HouseIt ain't over here yet either. While the Democrats failed to pick up their hoped for 30 seats, they did get more than 20 and will likely end up with 255-260 seats in the House. Nevertheless, a number of seats are undecided. One of them is the CA-04 open seat being vacated by John Doolittle, who is under investigation on various corruption charges. Currently Tom McClintock (R) is leading Charlie Brown (D) by 451 votes, but there are tens of thousands of absentee and provisional ballots yet to be counted in this R+11 district. In LA-04, there will be a runoff Dec. 6th between Paul Carmouche (D) and John Fleming (R). In MD-01, Democrat Frank Kratovil is ahead of Republican Andy Harris by 915 votes, but there are 25,000 absentee ballots yet to be counted. In OH-15, Steve Stivers (R) is leading Mary Jo Kilroy (D) by 321 votes, so a recount is likely. In VA-05, challenger Tom Perrillo (D) has a 31-vote lead over incumbent Virgil Goode (R). A recount is assured there. Finally, in WA-08, incumbent Dave Reichert (R) has a 1900-vote lead over Internet darling Darcy Burner (D), but absentee ballots are still coming in and could change the result. Swing State Project has more. Analysis of the Bradley EffectA hot topic the entire year has been the so-called "Bradley effect," which hypothesizes that white people being polled will happily tell a pollster that they will vote for a black person, but in the privacy of the voting booth, don't do it. Finally we have real data to see whether that effect exists and if so, how big it is. Polling in elections where the outcome is certain in advance do not make good test cases, so let us examine the major swing states: Colorado, Florida, Indiana, Missouri, Nevada, New Mexico, North Carolina, Ohio, and Virginia. For each of these states, we looked at the final October/November poll from the following major pollsters: ARG, Insider Advantage, Mason-Dixon, Opinion Research, Quinnipiac University, Rasmussen, Research 2000, and SurveyUSA. The polling data are given below.
For each state, the (unweighted) average of all the polls listed was computed, as shown on the lines marked "Average." These numbers cannot be compared directly to the final results due to the undecideds. To make this comparison possible, the ratio of the total Obama+McCain vote divided by the Obama+McCain polling numbers was computed for each state. For example, in Colorado, the Obama plus McCain poll averages add up to 96.5% while the actual vote totals add up to 98.4%. Thus the scale factor is 98.4/96.5 = 1.020. The Colorado polls were then multiplied by 1.020 so they added up to 98.4%, just as the actual vote did. These scaled polls are given on the lines labeled "Average multiplied by x." These numbers can be directly compared to the election results since they add up to the same thing. In Colorado, for example, the scaled poll predicted an Obama vote of 52.7% and a McCain vote of 45.9%. The candidates got 52.5% and 45.9%, respectively. Thus the polls were remarkably close to the actual vote and there is not a hint of Obama polling well but doing badly on election day. Now look at the eight other swing states. In Florida the pollsters were right on the money. In Indiana, Missouri, North Carolina, Ohio, and Virginia they were off by a maximum of 1.2% for Obama. In the other two states, Nevada and New Mexico, the polls for Obama were off by 4.1%, which is within the margin of error. In both cases Obama did better than predicted, so clearly there is no Bradley effect here. If nothing else, any future discussions of the "Bradley effect" can be quickly ended with the statement: "It didn't exist in 2008." Comparison of the PollstersThere are various ways to compare the pollsters. Professional statisticians look to see if the actual results were within the bracketed range predicted by the pollster. For example, if a pollster predicted Obama 51% and McCain 49% with a 3% margin of error and the final result was McCain 51% and Obama 49%, the pollster would claim to have gotten it right because Obama fell within the predicted range of 48% to 54% and McCain fell into the predicted range of 46% to 52%. Laymen would probably say the pollster got it wrong--because they don't understand what the prediction really is. To keep it simple, let us use the second approach and see which pollsters predicted which states right. Here are the data.
In some cases the pollster predicted a tie, that is, said it was too close to call. Let us remove those from the sample. In that case the scores for these pollsters are given in the last two columns. If you want to play with the data yourself, here they are .csv format. McCain-Palin Infighting Is Leaking OutIt is traditional in losing campaigns for everyone to blame everyone else, but the finger pointing in the McCain/Palin campaign is rapidly becoming public. The McCain people blame Palin for her outrageous shopping habits and her unwillingness to shut up and take orders. The Palin people counter with the point that the RNC told Palin to go buy some nice clothes and that if they had not tried to micromanage her, she would have been much more effective. McCain's race is run; he might get reelected to the Senate once more (although he will have a tough race against Arizona's governor Janet Napolitano in 2010), but that's about it. Palin, in contrast, has a decent shot at becoming the de facto leader of a new generation of Republicans and is very concerned about her public image and doesn't want to be the scapegoat for the Republican loss on Tuesday. Results on PropositionsIn addition to electing candidates for various offices, voters on Tuesday made decisions on numerous propositions on hot-button items. In South Dakota, voters refused to ban abortions. In Colorado, they also refused to define a fertilized egg as a full-blown human being with all the rights afforded by state and federal law (a consequence of which would be to make a doctor performing an abortion guilty of first-degree murder and the woman getting the abortion an accomplice). In California, Proposition 4, which would have prevented teenage girls from getting abortions until their parents were notified narrowly trailed, but the results are not definitive yet. Proposition 8, which bans same-sex marriage passed in California, along with similar bans in Florida and Arizona. Massachusetts voters decriminalized marijuana and Michigan voters voted to allow it for medical purposes. Missouri voters made English the official state language. And California passed a proposition mandating better treatment of farm animals. Collection of Front PagesGeoff Menegay has collected the front pages of many newspapers depicting Obama's historic victory. Thanks, Geoff. Unhappy About the Election and Want to Leave the Country?If you are unhappy about the election results and want to leave the country and are interesting in getting a Masters Degree in Computer Systems, check out this English-language program in Parallel and Distributed Systems in Amsterdam at the Vrije Universiteit, one of the top private universities in Europe. In fact, even if you are happy about the results, it might be of interest. If you like this Website, tell your friends. You can also share by clicking this button
|
Your donation is greatly appreciated. It will buy ads to publicize the site. | |||||||||||||||||||||||||||||||||||||||||||||||||||||||||||||||||||||||||||||||||||||||||||||||||||||||||||||||||||||||||||||||||||||||||||||||||||||||||||||||||||||||||||||||||||||||||||||||||||||||||||||||||||||||||||||||||||||||||||||||||||||||||||||||||||||||||||||||||||||||||||||||||||||||||||||||||||||||||||||||||||||||||||||||||||||||||||||||||||||||||||||||||||||||||||||||||||||||||||||||||||||||||||||||||||||||||||||||||||||||||||||||||||||||||||||||||||||||||||||||||||||||||||||||||||||||||||||||||||||||||||||||||||||||||||||||||||||||||||||||||||||||||||||||||||||||||||||||||||||||||||||||||||||||||||||||||||||||||||||||||||||||||||||||||||||||||||||||||||||||||||||||||||||||||||||||||||||||||||||||||||||