
Dem
47

GOP
53

The Cook PVIs compare how each congressional district (and each state) voted in the past two presidential elections vs. the national average. The PVIs we have been using recently were based on the 2016 and 2020 presidential elections. However, there is now data for each district for the 2024 election, so The Cook Political Report has updated the PVIs to be based on the 2020 and 2024 elections instead (with 2024 weighted more heavily than 2020). The new PVIs were released (behind a paywall) last week. Here is a map of the country by congressional district with each one colored by its new PVI:
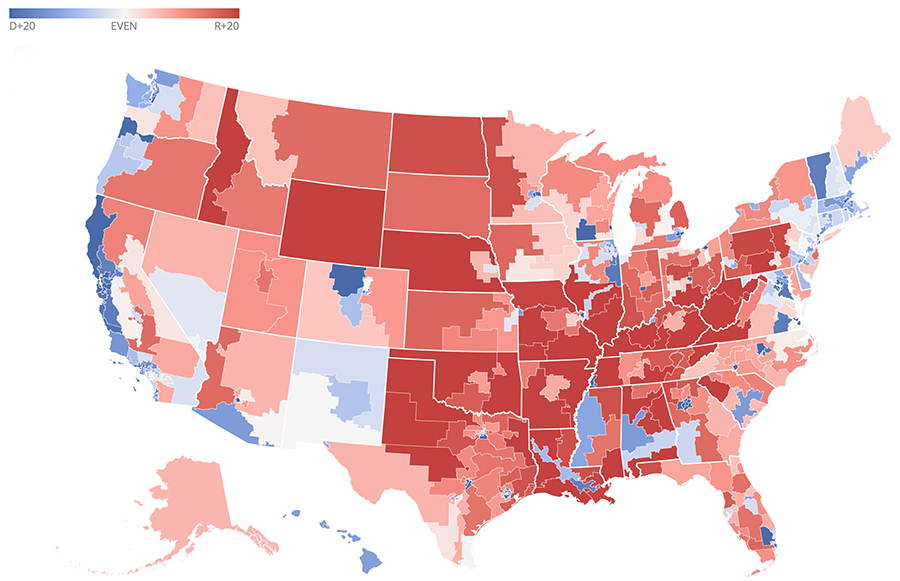
A simple visual inspection shows many well-known things. For example, eastern Washington, Oregon, and California are very different from the coastal regions. Many states are entirely red, while Hawaii and Delaware are the only states outside of New England with only blue districts. James Carville talked about Pennsylvania being Pittsburgh and Philadelphia with Alabama in between and the map verifies that. Some of the swing states, like Wisconsin, Michigan, and North Carolina, are almost entirely red except for one or two extremely blue districts. More generally, Democrats are packed into a tiny fraction of the area of most states outside the South. Looking at the map, you wouldn't think Minnesota was a blue state, but it is.
There are a number of interesting results that are not visible from the map. First, many minority voters voted for Donald Trump, so some heavily minority districts went from D+bignumber to D+lessbignumber. For example, the Blackest district in the country, GA-13, south of Atlanta, which is two-thirds Black, went from D+28 to D+21. The second Blackest district, AL-07, which includes Birmingham and Selma, didn't change as much, going from D+14 to D+13.
Second, the number of swing districts (D+5 to R+5) has gone up slightly, from 82 to 87, which is 20% of the House. Compare that to 1999, when 164 seats were in swing districts. All of these swing districts could be in play in 2026.
Third, there are more red districts R+6 or more (181) than blue districts D+6 or more (156).
Fourth, the bluest districts are bluer than the reddest districts are red. There are 15 at D+30 or bluer but only 2 districts are R+30 or redder. This is due to Democrats clustering in cities.
Fifth, the number of representatives in the "wrong" district is very small. Only three Republicans are in a D+x district: Don Bacon (NE), Brian Fitzpatrick (PA), and Mike Lawler (NY). However, there are seven Democrats in R+x districts: Henry Cuellar (TX), Don Davis (NC), Jared Golden (ME), Adam Gray (CA), Marcy Kaptur (OH), Marie Perez (WA), and Kristen Rivet (MI). All 10 of these will be top targets in 2026.
Sixth, Republicans drew far more maps than Democrats. Part of that is because there are more states with Republican trifectas than Democratic trifectas, but also because Democrats are "good government" types and (foolishly?) adopt constitutional amendments hamstringing their own legislatures from gerrymandering the hell out of the map by requiring independent commissions to draw the map. In all, 180 districts were drawn by Republicans vs. 67 drawn by Democrats. (V)