
In sheep farming, "herding" is the act of getting all the sheep to move in the same direction, preferably the one the farmer wants. Sometimes, dogs are trained to help out. In polling, "herding" is the act of looking at all the other polls and then somehow massaging your data to make it look more like the other ones. In sheep farming, herding is good. In polling, herding is bad.
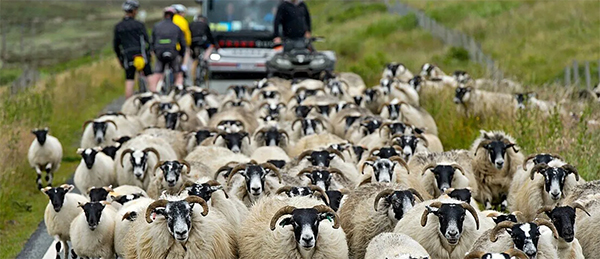
Nate Silver used to run his own show, then went to work for The New York Times, then for ABC News, and is now back to running his own show, Silver Bulletin. He just wrote an interesting column about herding, complete with an illustrative photo of it in one of these two domains:

Silver analyzed the polling data for October in the seven swing states, ran some math on them, and concluded that there should be more outliers. Basically, in a sample with a mean (average) M and a standard deviation S, 95% of the data should fall between M-2S and M+2S. Five percent should be outliers, half below M-2S and half above M+2S. He didn't observe this in the data. When pollsters quote a margin of error of 4, this is (by convention) two standard deviations. In polling terms, 2.5% of the time the true mean will be outside the margin of error on the high side and 2.5% of the time it will be outside the margin of error on the low side. This has nothing to do with bad polling methodology or shy voters. It's just math and also applies when estimating the number of pages in a library book by sampling 1,000 books in a library. Sometimes you get a freaky sample and the mean is way off. This is normal and expected.
How could herding happen? If a polling team gets a result that is way different from other published results, the team may begin to question its methodology or sample and begin to wonder if it did something wrong. All polls are corrected to make sure the gender, age, partisan, race, education, income, and other distributions match the expected electorate. The team may then begin fiddling with the corrections to make their results look like everybody else's. It may not be malicious. The team members may just be afraid they did something wrong and want to fix it.
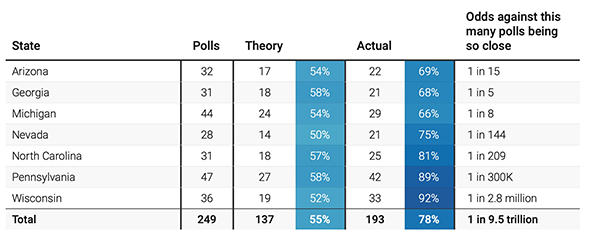
Put in a different way, suppose you collect 20 polls of Wisconsin from different pollsters, each sampling 1,000 people. If all 20 showed an exact tie, your reaction should be: I smell something fishy (or maybe sheepy) here. Math doesn't work like that. Silver published this table showing how many polls showed the candidates within 2.5 points and what the odds are of so many polls being that close, even if the state is a true tie:

Wisconsin is the worst of the bunch. The chances of 92% of the polls being within 2.5 points, even if the voters really are exactly equally divided, is 1 in 2.8 million. The chances of 193 out of 249 polls being that close is 1 in 9.5 trillion.
There are a couple of explanations. First, there is curbstoning, the practice of a pollster just sitting on the curb outside and making up the numbers and not actually conducting a poll. This is basically fraud. Silver is moderately picky about which pollsters he allows (and we are even pickier). We doubt this is a factor.
Second, the pollster could muck with the data or the model of the electorate to get a "better" result. That is easy to do and easy to justify internally ("We think women will be very motivated by abortion, so let's assume 54% of the electorate will be female this time, even though it was 52% last time.")
Third, if a pollster gets an unexplained strange result, the pollster (or sponsor) might just decide not to publish it. This biases the aggregates by not including valid data that should be included. If you want to measure the average height of American men and then throw out all measurements below 5'4" as improbable, your average will be too tall.
Fourth, pollsters may be terrified of underestimating Trump again, so they "correct" the data. One scheme we had considered for our map and rejected is to compute how much the polls under or over estimated Trump in 2020 and apply that correction. So if polls predicted Trump would get 44% in Wisconsin in 2020 and he got 49%, then a pollster could simply add 5 points to the sample. Ditto for all the other states.
Herding, either intentional or otherwise, reduces the accuracy of the aggregates because the underlying assumption is that the polls are independent. If half the polls are in effect copying the other half, they aren't independent. Silver concludes by noting that in his simulation model, the chance that all seven swing states end up within 2.5 points is about 0.02. In other words, expect some blowouts, possibly in opposite directions in different states. (V)