State Polls
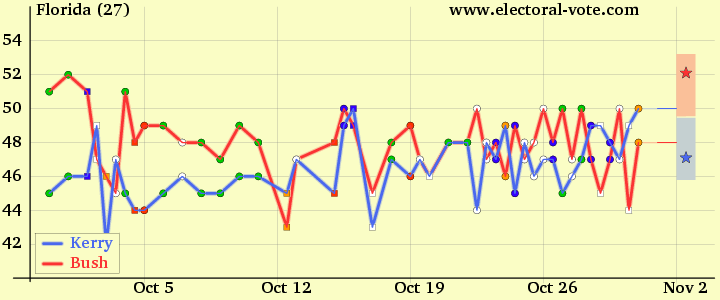
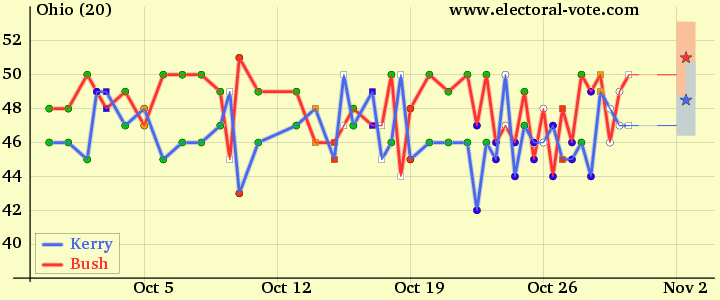
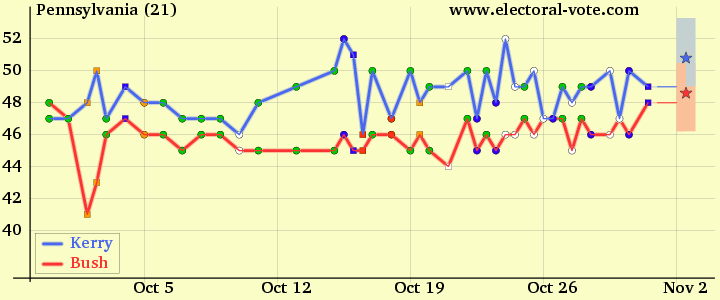
Here are the polls used in Polling data file. The middle data of the poll determines where on the x-axis the point is plotted. Because it takes a few days to process and release polls, the most recent poll will always be plotted several days before today. On the expanded October-only graphs, the gray vertical lines shows the Tuesdays leading up to election day.
- The lines are computed using the least squares method
- Polls older than 21 days are not used in the computation
- Although the points are plotted on the day we reported the poll, the lines use the actually polling dates
- If fewer than three polls are available in the previous 21 days, the current value is extrapolated to November
- When there are few polls available or they are inconsistent, the results will be weird
- As we approach election day, the quality of the predictions will improve
- Do not believe everything you see on the Internet
For each line, an error bar is shown on Nov. 2. Is was generated by computing the deviation of each poll from the line, squaring the deviation, adding up the squared deviations for al the polls, computing the average squared deviation, and then taking the square root of the average squared deviation. This metric is commonly used by statisticians and shows how well the line fits the data. A small error bar means a good fit. A large error bar means a bad fit. The error bars are NOT a margin of error as in the polls themselves and are certainly not a good measure of who is going to carry the state.
The graphs for the "Big Three," Florida, Ohio, and Pennsylvania are included below. Only the October data are plotted. These are the key states to watch. Whoever wins the majority of them will probably win the election. For the other states click on the state abbreviation. After viewing the graph, use your browser's Back Button to return to this page.
AL AK AZ AR CA CO CT DE DC FL GA HI ID IL IN IA KS KY LA ME MD MA MI MN MS MO MT NE NV NH NJ NM NY NC ND OH OK OR PA RI SC SD TN TX UT VT VA WA WV WI WYFlorida


Ohio


Pennsylvania

