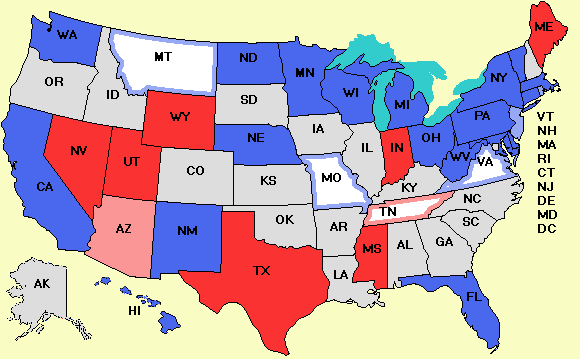
New Senate: 51 Democrats 49 Republicans
|
|
| Nov. 12 | Pickups: | Missouri, Montana, Ohio, Pennsylvania, Rhode Island, Virginia | |
News from the Votemaster
Let's take a look at how the Senate pollsters did. Below is a table that gives the final vote in column 2, followed by the results of 8 pollsters. Each cell consists of the Democratic percentage minus the Repubican percentage. For example, in Arizona, the Democrat - Republican value is -9, meaning the Republican won by 9%. In California, the last poll from Mason-Dixon predicted a Democratic win by 30% (it was actually only 24%). For purposes of these tables, Lieberman is a Republican and Sanders is a Democrat so I can reduce each race to a single number. The data is available in .csv format.
| State | Vote | Gallup | M-D | Polimetrix | Quinn. | Ras. | Res. 2000 | SurveyUSA | Zogby |
| Arizona | -9 | -8 | -4 | -9 | -13 | -8 | |||
| California | 24 | 30 | 32 | 23 | 29 | ||||
| Connecticut | -10 | -4 | -12 | -8 | -12 | -11 | -12 | ||
| Delaware | 41 | ||||||||
| Florida | 22 | 24 | 26 | 35 | 17 | 18 | 23 | 29 | |
| Hawaii | 24 | ||||||||
| Indiana | -87 | ||||||||
| Maine | -53 | -46 | |||||||
| Maryland | 10 | 15 | 3 | 6 | 5 | 3 | 5 | ||
| Massachusetts | 38 | 40 | 30 | ||||||
| Michigan | 16 | 16 | 15 | 16 | 11 | 10 | 7 | ||
| Minnesota | 20 | 10 | 10 | 18 | 14 | 16 | 8 | ||
| Mississippi | -29 | -37 | |||||||
| Missouri | 3 | 4 | 1 | 0 | -1 | 0 | 6 | 3 | |
| Montana | 1 | 9 | 0 | 2 | 1 | ||||
| Nebraska | 28 | 20 | |||||||
| Nevada | -14 | -17 | -11 | -12 | -14 | -21 | |||
| New Jersey | 8 | 10 | 7 | 6 | 5 | 5 | 6 | 12 | |
| New Mexico | 42 | 24 | 20 | ||||||
| New York | 36 | 35 | 30 | 24 | |||||
| North Dakota | 40 | 22 | |||||||
| Ohio | 12 | 2 | 6 | 18 | 12 | 12 | 12 | 7 | |
| Pennsylvania | 18 | 18 | 13 | 16 | 10 | 13 | 8 | ||
| Rhode Island | 6 | 3 | -1 | 8 | 14 | ||||
| Tennessee | -3 | -3 | -12 | -5 | -4 | -5 | -10 | ||
| Texas | -26 | -36 | -26 | -19 | |||||
| Utah | -31 | -30 | -32 | ||||||
| Vermont | 33 | 32 | 21 | ||||||
| Virginia | 0.2 | -3 | 1 | 0 | 0 | 8 | 1 | ||
| Washington | 17 | 16 | 14 | 11 | 8 | 4 | |||
| West Virginia | 30 | 34 | 33 | ||||||
| Wisconsin | 37 | 45 | 27 | 9 | |||||
| Wyoming | -40 | -41 | -27 |
To see how well a pollster did, we can subtract the actual difference between the candidates from the predicted on. For example, in the table below, if we subtract from Mason-Dixon's prediction for Arizona (-8) the actual vote total (-9) we get 1. In other words, Mason-Dixon predicted that the Democrat would do 1% better than he actually did. A perfect pollster would have a column consisting entirely of 0s. Since the margin of error in predicting each candidate's score is about 4%, the margin of error in predicting the difference is about 8%. Thus to a first approximation, any number less than or equal to 8 should be considered a correct prediction. Anything more than 8 is wrong. However, using the standard 95% level of confidence, about 1 in 20 polls should be "wrong."
| State | Gallup | M-D | Polimetrix | Quinn. | Ras. | Res. 2000 | SurveyUSA | Zogby |
| Arizona | 1 | 5 | 0 | -4 | 1 | |||
| California | 6 | 8 | -1 | 5 | ||||
| Connecticut | 6 | -2 | 2 | -2 | -1 | -2 | ||
| Delaware | ||||||||
| Florida | 2 | 4 | 13 | -5 | -4 | 1 | 7 | |
| Hawaii | ||||||||
| Indiana | ||||||||
| Maine | 7 | |||||||
| Maryland | 5 | -7 | -4 | -5 | -7 | -5 | ||
| Massachusetts | 2 | -8 | ||||||
| Michigan | 0 | -1 | 0 | -5 | -6 | -9 | ||
| Minnesota | -10 | -10 | -2 | -6 | -4 | -12 | ||
| Mississippi | -8 | |||||||
| Missouri | 1 | -2 | -3 | -4 | -3 | 3 | 0 | |
| Montana | 8 | -1 | 1 | 0 | ||||
| Nebraska | -8 | |||||||
| Nevada | -3 | 3 | 2 | 0 | -7 | |||
| New Jersey | 2 | -1 | -2 | -3 | -3 | -2 | 4 | |
| New Mexico | -18 | -22 | ||||||
| New York | -1 | -6 | -12 | |||||
| North Dakota | -18 | |||||||
| Ohio | -10 | -6 | 6 | 0 | 0 | 0 | -5 | |
| Pennsylvania | 0 | -5 | -2 | -8 | -5 | -10 | ||
| Rhode Island | -3 | -7 | 2 | 8 | ||||
| Tennessee | 0 | -9 | -2 | -1 | -2 | -7 | ||
| Texas | -10 | 0 | 7 | |||||
| Utah | 1 | -1 | ||||||
| Vermont | -1 | -12 | ||||||
| Virginia | -3 | 0 | 0 | 0 | 7 | 0 | ||
| Washington | -1 | -3 | -6 | -9 | -13 | |||
| West Virginia | 4 | 3 | ||||||
| Wisconsin | 8 | -10 | -28 | |||||
| Wyoming | -1 | 13 |
Finally, let us see what the gurus predicted for the Senate. Here are the results from the Nov 7 Web page. The first number is the number of Democrats, then the number of Republicans, then the number of tossups (if present). As you can see, the polling algorithm used on this site got it perfect (every state right), but I was chicken and didn't want to call Montana and Virginia, even though the data predicted a Democratic win in both Montana and Virginia.
| Guru | Actual vote | Prediction |
| Congressional Quarterly | 51-49 | 48-48-4 |
| Charlie Cook | 51-49 | 49-49-2 |
| Stu Rothenberg | 51-49 | 51-49 |
| Larry Sabato | 51-49 | 51-49 |
| Chuck Todd | 51-49 | (Note 1) |
| Electoral-vote.com | 51-49 | 51-49 |
| Votemaster | 51-49 | 49-49-2 |
Note 1: Either 48-52 or 52-48 but not in between.
I may not be able to get to the computer for a couple of days, but I will try to do this analysis for the House sooner or later.
Projected New House*: 230 Democrats 197 Republicans 8 Ties
See complete House polls.Dem pickups: AZ-05 AZ-08 CA-11 CO-07 CT-05 FL-16 FL-22 IA-01 IA-02 IN-02 IN-08 IN-09 KS-02 KY-03 MN-01 NC-11 NH-01 NH-02 NY-19 NY-20 NY-24 OH-18 PA-04 PA-07 PA-08 PA-10 TX-22 WI-08
GOP pickups:
If you like this site, please announce it to news groups and blogs and tell your friends about it. If you have your own blog, please click on "For bloggers" above.
-- The Votemaster