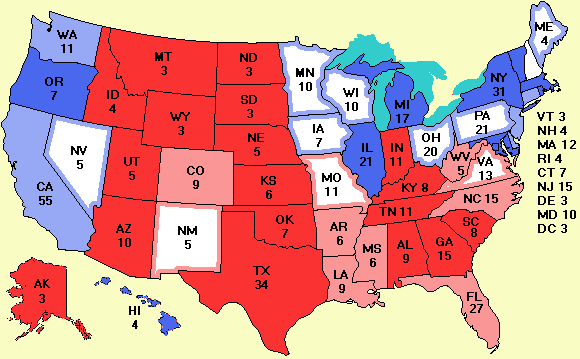
Electoral Vote Predictor 2004: Kerry 280 Bush 254
|
|


| Oct. 11 | New polls: AR MA MN |
 |
 Welcome
 FAQ
FAQ Donations
 Electoral college
 Electoral college graph
 Political humor
 Political websites
 Articles and books
 Kerry and Bush records
 Senate races
  About RSS feeds
  Enhancements
  Posters
 News from the Votemaster
Mondays are always quiet and today is no exception. An Opinion Research poll in Arkansas breaks the tie there and puts Bush ahead by 9%. I don't think Kerry really has much of a chance in Arkansas. The south, except for Florida, looks pretty solid for Bush, although there might be surprises in one or two border states. Kerry edged ahead again in Minnesota.
Zogby did a large (N = 1216) telephone poll Oct. 7-9 (thus, after the second presidential debate) and found the race to be a statistical tie, with Kerry at 46%, Bush at 45%, Nader at 0.9%, Cobb at 0.2%, Peroutka at 0.2%, and Badnarik at 0.1%. The rest are still undecided. I guess they are waiting for the third debate, on Wednesday. Some people like to collect all the data before coming to a conclusion. Interestingly, Zogby also found that among newly registered voters, Kerry holds a 5% lead. Given the millions of people who registered for the first time this year, new voters (along with the millions of overseas voters) could be a serious factor.
After many attempts to turn the predicted map into something believable, I have concluded there are too many outliers, too much noise in the data, too many differences between the pollsters and too many voters who can't make up their minds, I have given up and removed the predicted map from the main page. Look at the state graphs to see the nature of the problem. The data are not converging. There is no pattern here. I tried different time intervals and different weighting schemes, but nothing seems reasonable. The quality of the data just isn't good enough. I think the current map is a far better predictor than the 'predicted' map ever was. Chalk one up to experience. The predicted map will still be available but under its true file name. Today that is www.electoral-vote.com/fin/oct11p.html. Tomorrow it will be oct12p.html etc.
However, replacing the predicted map on the menu below the map is a new page called Compare the pollsters. This page shows maps and charts per pollster so you can see how they differ. You be the judge who has their thumb on the scale. I will drop a polling firm only when a mainstream media outlet has caught them red-handed. Some people have asked for a method to make their own maps selecting only pollsters favorable to their candidate. While this is theoretically possible, the computing load it would place on the server would be too much. That could be reduced by my computing two maps in advance: one where Kerry wins and one where Bush wins, but I am not sure of the value of such maps. On the More data page there are links to two sites where you can concoct your own data and make your own maps.
Also new is a menu item labeled Posters. It contains several 8.5" x 11" posters you can print out and hang up on your office or school bulletin board to help attract new visitors. More posters are welcome. Thanks to Kelly Marks for poster 1 and the people at SnapFood.com for poster 2.
There is now an easy way to send e-mail to tell friends about this site. At the bottom of this page, just below the projected Senate, is a link to a little form where you can fill in a couple of fields and hit SEND E-MAIL. The e-mail address will be deleted instantly from the server after the mail has been sent. During testing, some mail to people with yahoo.com addresses got classified as bulk (spam). It is not clear why. Maybe Yahoo is sick of the election already. Other addresses work fine.
Finally, if you are new to this site, welcome. Please take a look at the Welcome page. It explains a lot about the site. There is MUCH more about the election than just the map. Also, I am now getting 400-600 e-mails a day. It is overwhelming. PLEASE PLEASE PLEASE read the FAQ before sending mail. Many common questions are answered there (e.g., Which polls do you use? What happens if the electoral college is tied? How well did the pollsters do in 2000?)
Projected Senate: 46 Democrats, 52 Republicans, 1 independent, 1 tossup
Click here to tell a friend about this site.
To bookmark this page, type CTRL-D (Apple-D on Macintoshes). If you are visiting for the first time, welcome. This site has far more about the election than just the map. See the Welcome page for more details.
|
|
