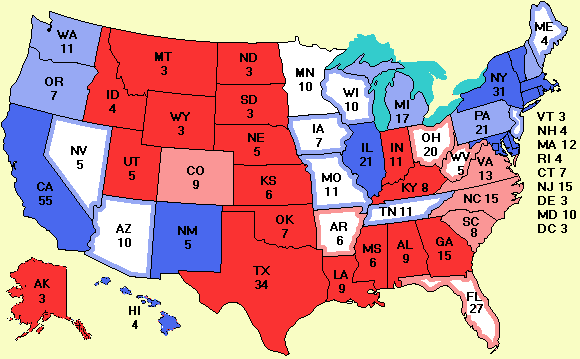
Electoral Vote Predictor 2004: Kerry 291 Bush 237
|
|


| July 29 | New polls: NJ |
| Welcome | Electoral college | FAQ |
| Americans abroad | Foreign nationals | President Bush's record |
| Political websites | Political humor | More data |
| Enhancements |
News from the Votemaster
The news today is meager. Only one new poll, in New Jersey, but the results are somewhat surprising. George Bush has moved up into a statistical tie with John Kerry there, possibly due to Nader's strong showing there (6%).
The site, however, has some other new data though. The 1992 and 1996 election maps and Excel spreadsheets are now available and will be reachable via the More data menu item throughout the campaign. With the 1992, 1996, 2000, and 2004 data available in Excel in the same format, statisticians can go wild mining the data for trends. As usual, all the Excel data on the site is also available in .csv format for easy manipulation in software. Just replace .xls with .csv in the file name.
Yesterday I asked the rhetorical question of why Kentucky was so Republican and neighboring Tennessee was much more closely divided. I thought it was due to Elvis' ghost being a Democrat. A reader came up with another suggestion. The African American population of Kentucky is 7.3%; the African American population of Tennessee is 16.4%, a difference of 9.1%. Nationwide, 90% of all African Americans vote Democratic. Computing 90% of 9.1% we get about 8%, and sure enough, Kerry's standing in Tennessee is 7% higher than in Kentucky. Might be some truth in this theory.
This site is currently listed on the www.i-am-bored.com in the category 'News.' Other sites featured here are devoted to topics such as 18-inch high horses and religious statues made of cheese (click on 2 at the bottom of the page). It is a fun site, but slightly disturbing. Is a site devoted to the subject of who is going to be the next president of the United States a weird oddity like the ones above? Half the people eligible to vote in this country don't. In other democracies, people think who is going to lead them is important and the voter turnout is usually 80% or more. Low voter turnout is not something Americans can be proud of. Urge all your friends and neighbors to register and vote.
On the other hand, there is a group of people who don't think this site is for weirdos: teachers. I have received a lot of mail from elementary school, high school and college teachers who use it in their classes. Math teachers use it to discuss statistical sampling. In other words, can you really expect to get an idea of what a million people think by asking only 1000? How accurate is that? Geography teachers ask what makes the red states different from the blue states? Why do people vote the way they do? Political science professors are interested in talking about the election process, campaigns, historical trends, and so on. Even some elementary school teachers have said they are using the site to explain how democracy works to their students. The Internet, as usual, is full of surprises.
We had over 20,000 visitors yesterday for the first time. Keep spreading the word.
To get the dates and sources for the polling data, click on the Excel spreadsheet at the top right. To bookmark this page, type CTRL-D. To help publicize this website, please link to it to improve its Google PageRank and tell your friends about it.
-- The votemaster Electoral college